Every view type
The seven ways to look at a database — table, list, board, gallery, calendar, timeline, and chart — and what each one needs.
A database holds one set of records. A view is a saved way of looking at them, with its own layout, filters, sorts, grouping, and visible fields. The same task database can be your triage table and the team’s status board at the same time, because those are two views over identical data.
Adding a view
-
Open the add-view menu
The view tabs run along the top of a database. Click the
+at the end of the tab row. -
Pick a layout
Choose Table, Board, Gallery, List, Chart, Timeline, or Calendar.
-
Choose who sees it
Toggle Personal — only visible to you before picking, if the view is just for you. Otherwise it’s shared with everyone who can see the database.
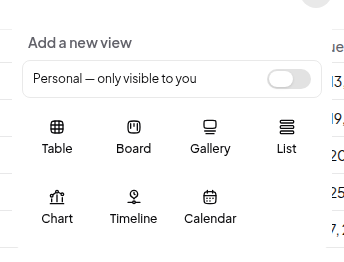
The new view becomes the active tab. Rename it by double-clicking the tab, or right-click a tab for rename, duplicate, copy link, change layout, and delete.
The seven layouts
Table
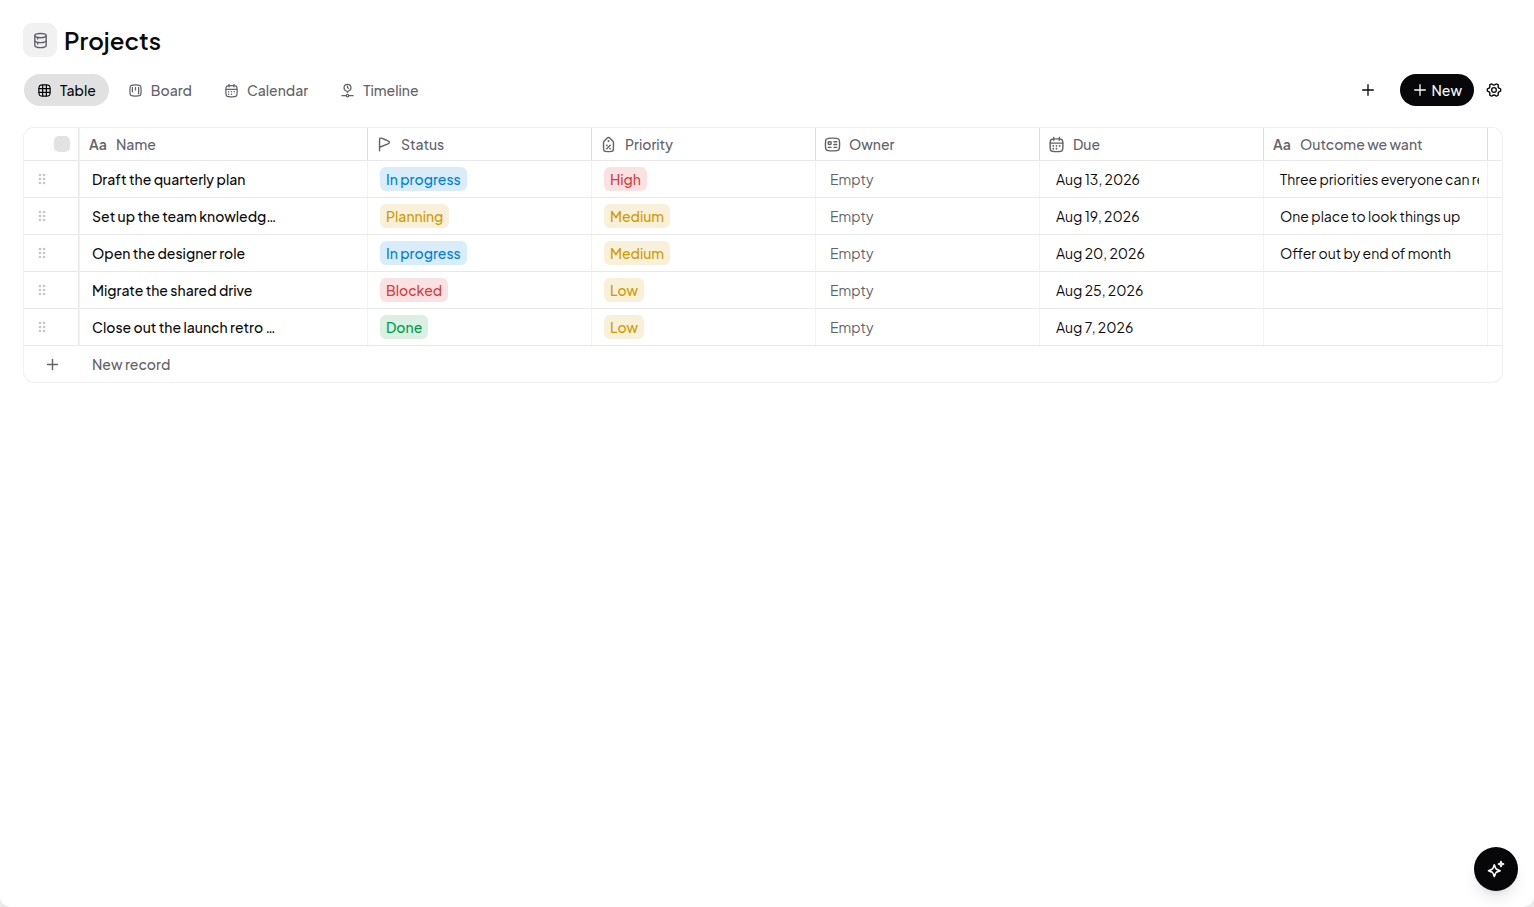
The grid. Rows are records, columns are fields. Best for scanning, editing in place, and bulk work. This is the only layout where you can add fields directly from the header row, and the only one that renders groups as collapsible sections inside the grid.
List
Compact rows, one record per line. Best for simple queues where you want titles and a couple of properties, not a full grid.
Board
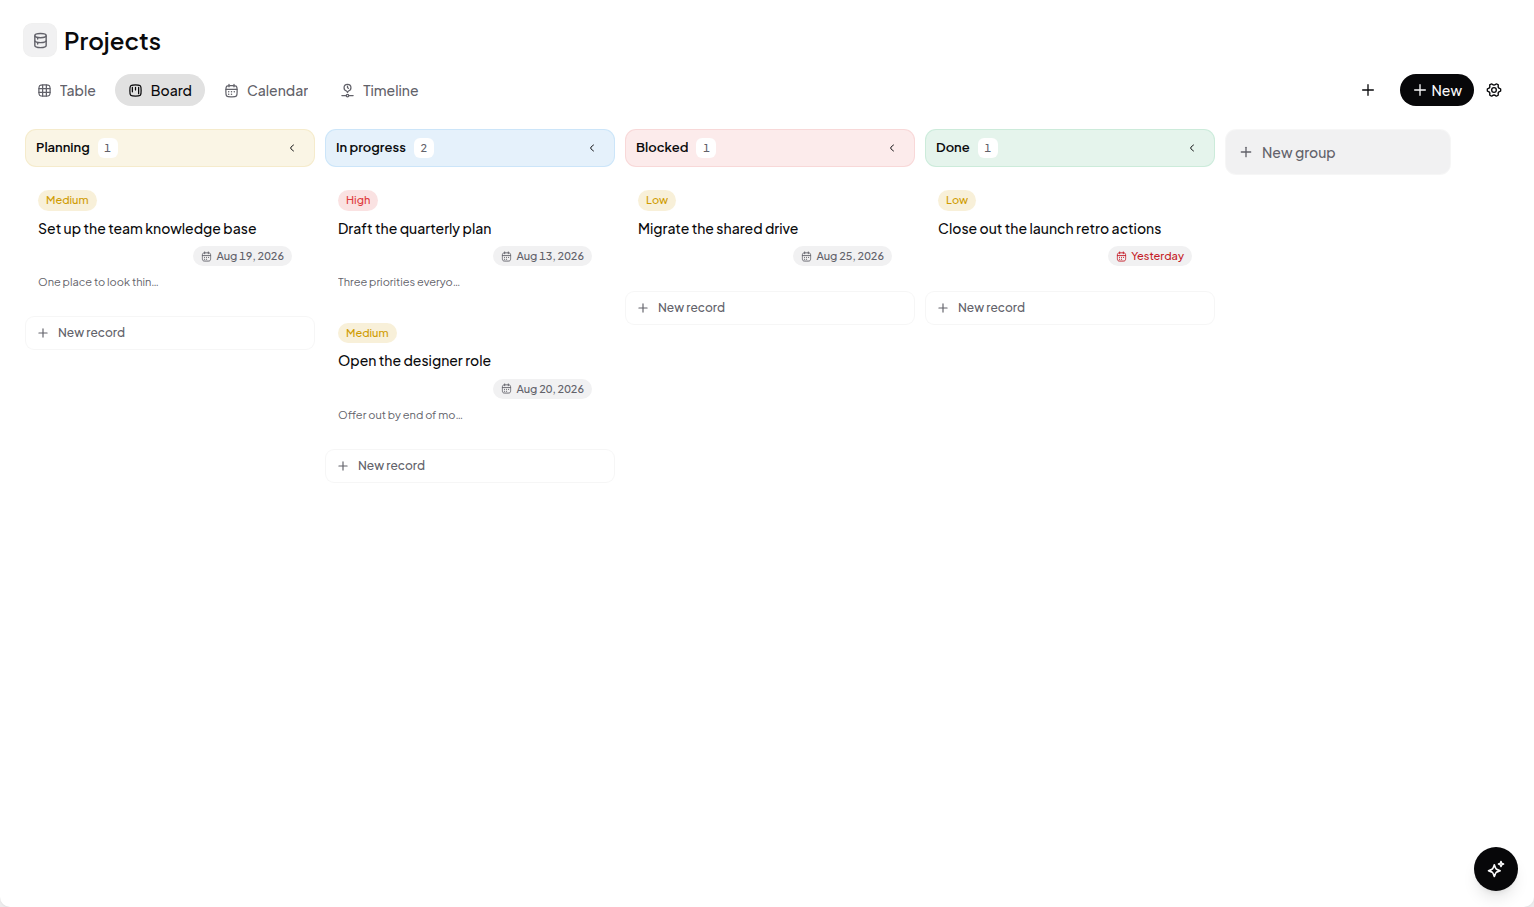
Cards in columns. Columns come from a Select or Status field, and dragging a card between columns writes that field. Best for anything that moves through stages.
Gallery
Cards with a cover image. Best for anything you recognise by sight — assets, products, people.
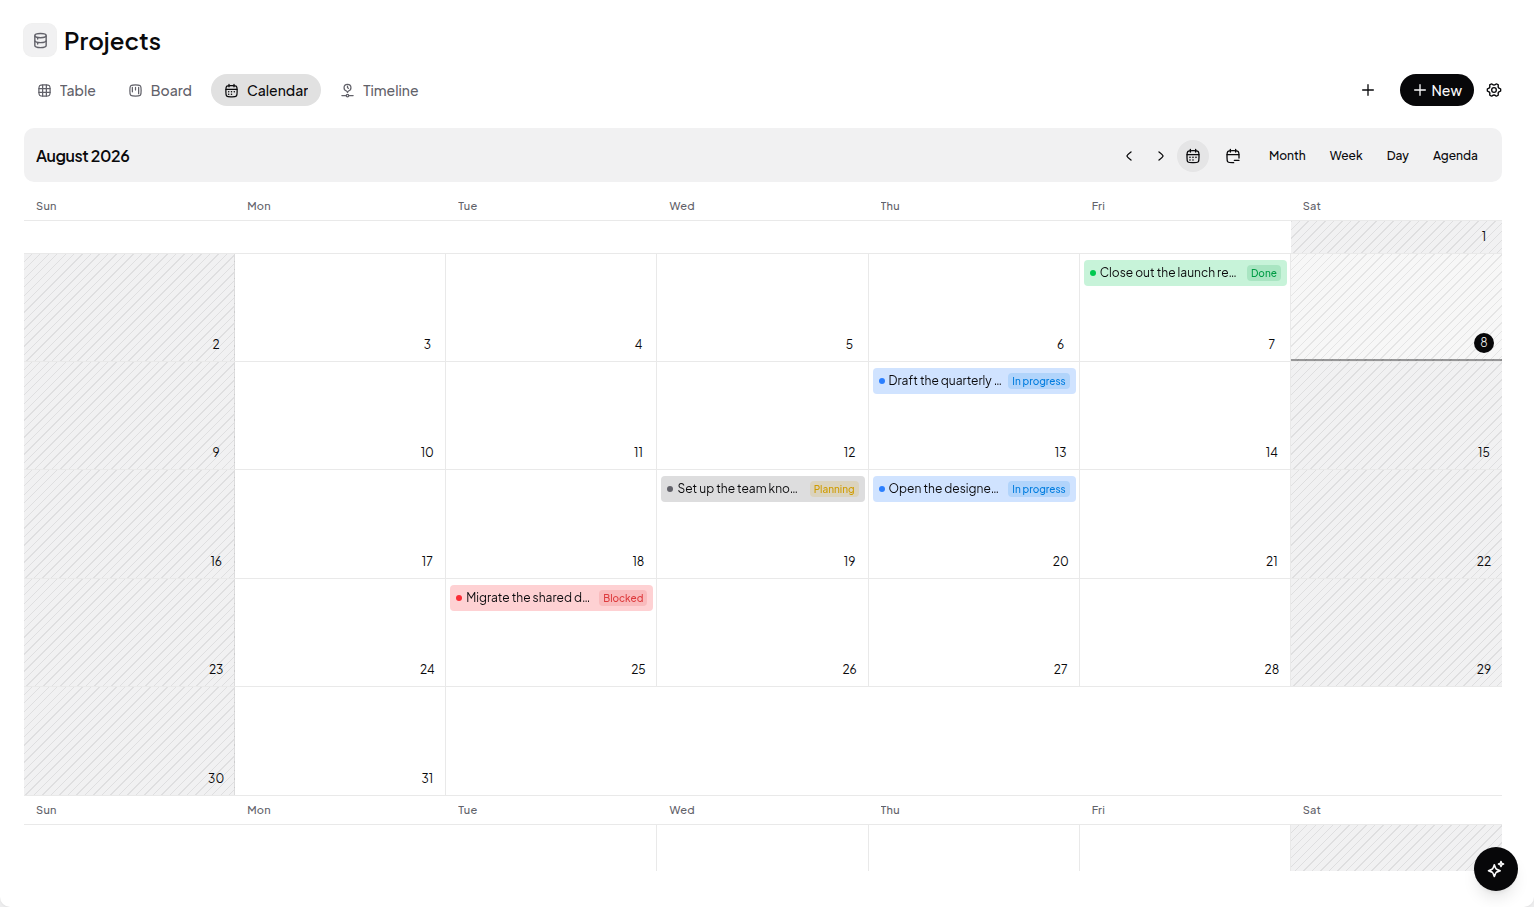
Calendar
Records placed on a month grid by a date field.
- Requires at least one Date field on the database.
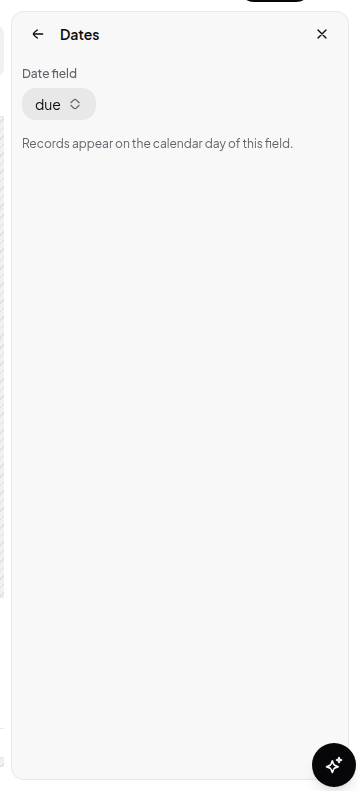
- Configure which field positions a record under View settings → Calendar date. With a start and an end field, records span days.
- Drag a record to another day to change its date.
- Week start and weekend display are configurable.
Timeline
Records as bars along a time axis — the same data as a calendar, laid out for duration and overlap rather than for dates on a page.
- Requires a date field; a second date field gives each bar a real length.
- Supports dependency lines between records and can highlight the critical path.
- The timescale is configurable.
Chart
Aggregates records into a picture instead of listing them. Chart types: vertical bar, horizontal bar, line, donut, and a single number. You choose what the axes count and group by, plus title, colour, height, stacking, and reference lines.
Changing an existing view’s layout
Right-click the view’s tab and pick a different layout. Filters, sorts, and visible fields carry over where they still apply — switching a table to a calendar keeps your filters and just asks which date field to place records by.
Per-view versus per-database
This is the distinction that trips people up most:
| Per view — changing it affects only that tab | Per database — changing it affects everyone, everywhere |
|---|---|
| Layout | Which fields exist |
| Filters | Field types and settings |
| Sorts | Select/Status options |
| Grouping | Record data |
| Which fields are visible, and their order | |
| Conditional formatting |
So hiding a field in your table doesn’t hide it for anyone else, but renaming a status option renames it for everyone.
Next: Filtering records, Sorting records, and Grouping records.